In three lines - The FINNS AI coach diagnoses eight areas — pace, heart rate, efficiency, stroke, frequency, volume, lessons, and personal traits — and prescribes concrete Try-This drills with distance, sets, and rest intervals included. - Heart rate zone distribution (Z1–Z5) and recovery heart rate trends give you a measurable picture of the intensity you are actually swimming at, not just the intensity you think you're hitting. - Switching the view to weekly, monthly, yearly, or all-time reveals long-term patterns that disappear inside individual sessions.
1. The Frustration of Solo Swimming — No One to Tell You What Needs Work
After enough laps on your own, a familiar thought surfaces.
"I did 1,500m today. Was that actually good?"
"Heart rate was high but pace didn't improve. What's going on?"
"I had my stroke corrected a while ago — is my SWOLF actually getting better, or not?"
In a coached environment these questions get answered right away. In a solo free-swim lane, you can make dozens of round trips without ever getting close to an answer. The numbers are there. What's missing is the context that connects them — what they mean, and what you should change.
That is the exact problem the FINNS AI coach is built to address. It reads your data and points to a direction: this area is the weak link right now, here is where to start.
2. The Eight-Area Diagnosis — What the Coach Actually Reads
The AI coach diagnoses your current state across eight areas.
- Pace — per-stroke, per-interval 100m-normalized pace and its variability
- Heart rate — Z1–Z5 zone distribution, peak HR during the session, recovery HR speed
- Efficiency — SWOLF score, distance traveled per stroke
- Stroke — per-stroke proportion and dominant stroke pattern
- Frequency — weekly session count and interval regularity
- Volume — weekly and monthly cumulative distance, average distance per session
- Lessons — coached vs. free-swim ratio, structure pattern inside lesson sessions
- Personal traits — time-of-day pattern, swim personality type, long-term trajectory
For each of these eight areas the app reads where you currently stand, then focuses its Try-This drill on whichever area has the most room to move.
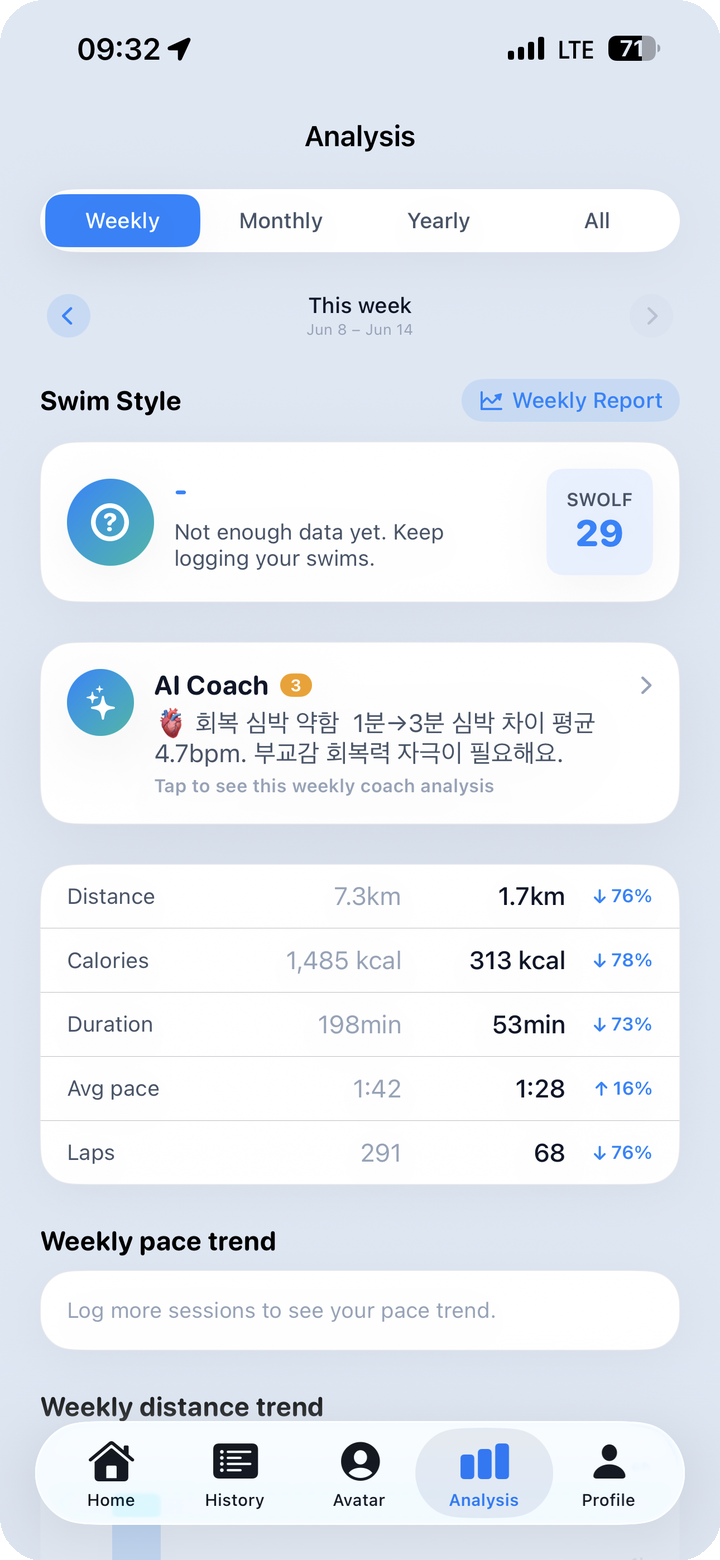
On the Analysis tab's weekly view, a swim personality card (for example: Endurance, with a SWOLF value) appears at the top, followed immediately by the AI coach card. That card surfaces specific feedback — something like breathing-and-recovery training, with a reference to how quickly your heart rate drops in the first one to three minutes post-swim. Below it, a metrics table shows this week's distance, calories, workout time, average pace, and lap count, each accompanied by a percentage change versus the prior week (▲ or ▼).
For a deeper look at how swim personality types are classified, see Post 05 — AI Coach and Swim Personality Types. This post stays focused on how the eight-area diagnosis turns into drill prescriptions.
3. Reading Change Through Week-over-Week and Month-over-Month Deltas
A single session's numbers tell you how much you did today. They do not show change. When the AI coach runs its eight-area diagnosis, it is the trend and the delta — not the raw value alone — that carries the most weight.
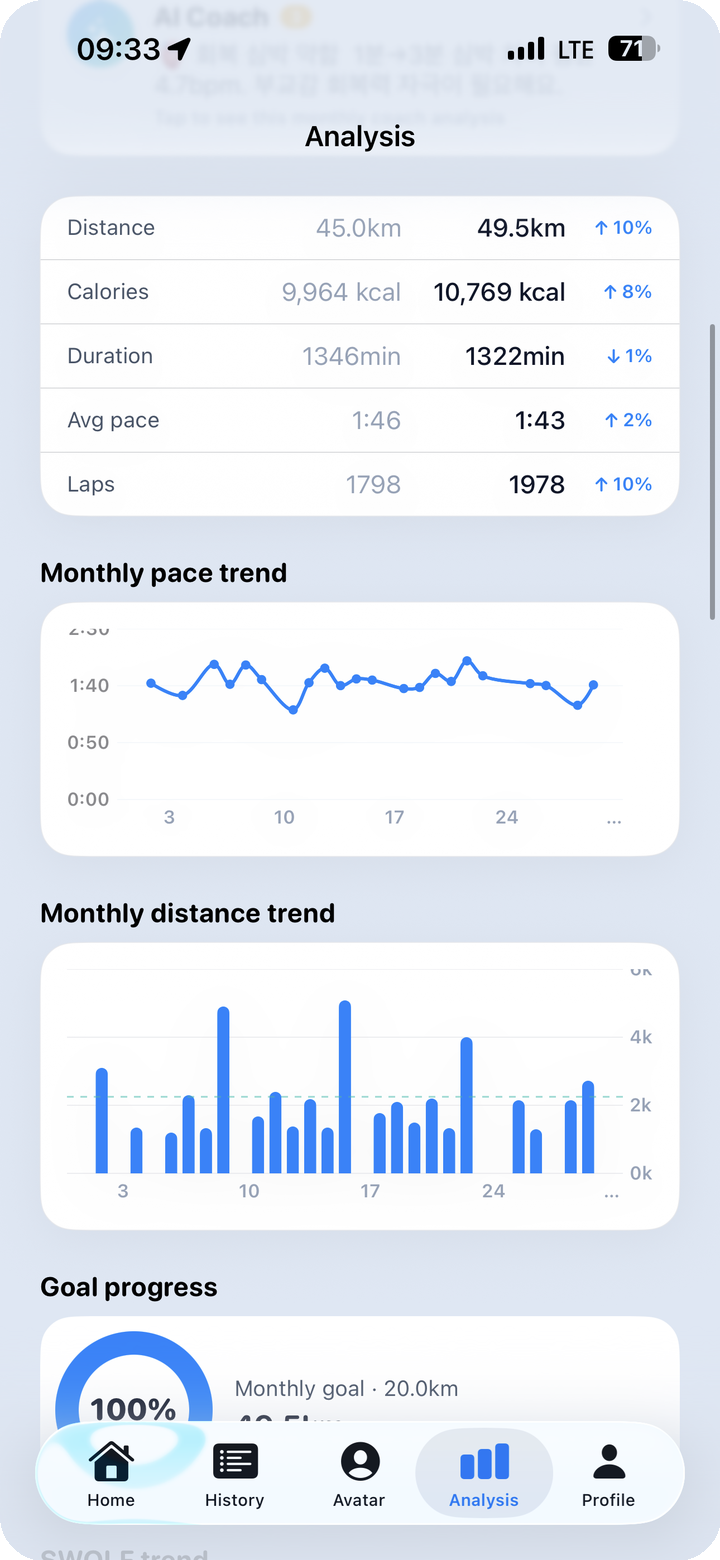
The analysis dashboard puts this picture on one screen.
- Distance trend: Bar graphs by day and period show the volume pattern across recent weeks. You can see whether output is building steadily or fluctuating.
- Weekly / monthly goal completion rate: The ratio of current distance to your target is shown as a number (for example: 100%).
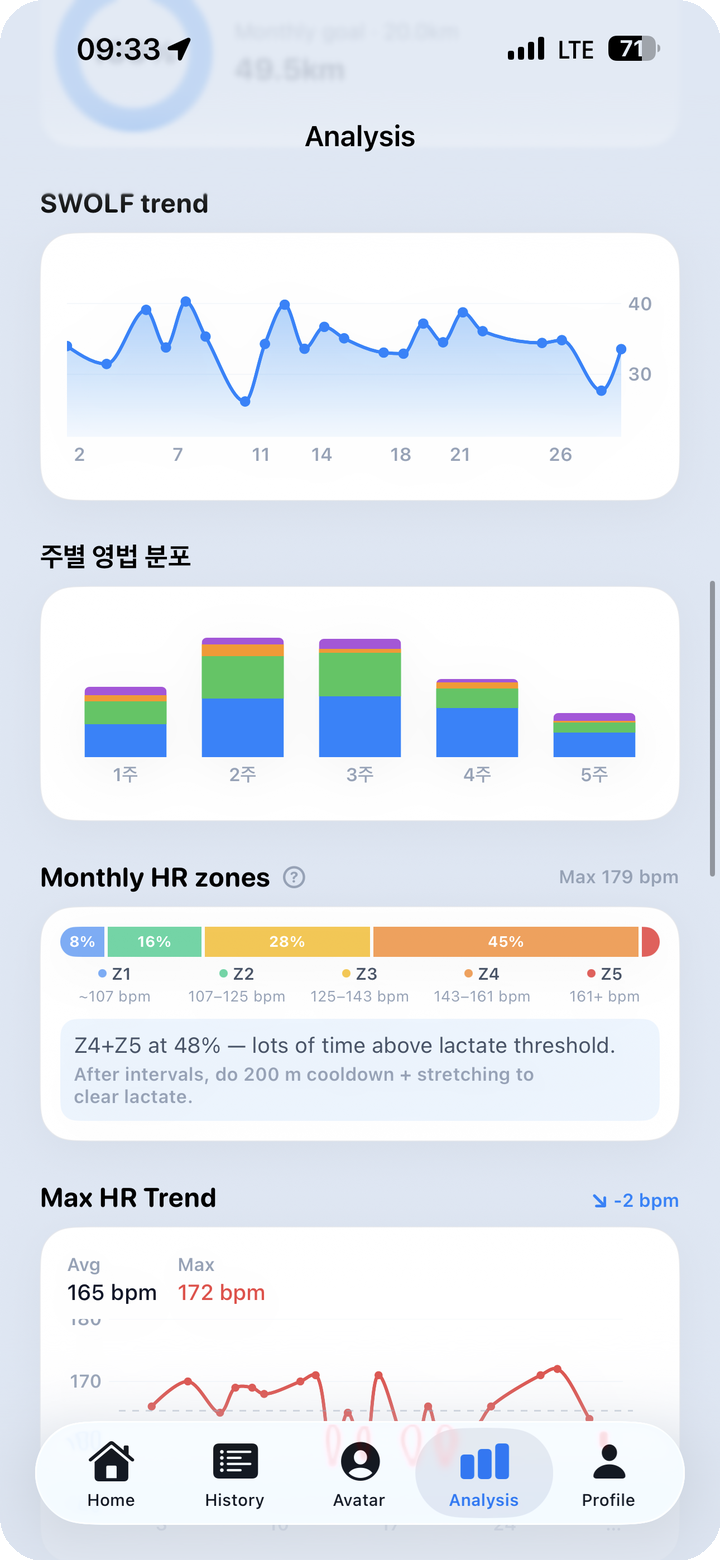
- SWOLF trend line: A declining SWOLF across sessions is a signal of improving stroke efficiency. A rising SWOLF alongside increasing volume may indicate accumulated fatigue or form breaking down under load.
- Stroke distribution by day of week: Which strokes dominated on which days is visualized as a pattern. A persistent spike in freestyle on Thursdays might simply reflect what the Thursday lesson menu looks like.
The week-over-week percentage change you check here is the raw material for the AI coach's diagnosis. If this week's volume is down 22% from last week and SWOLF is up two points simultaneously, the app interprets that combination and works it into the next coaching note.
4. Heart Rate as an Intensity Gauge — Z1–Z5 and Recovery Heart Rate
Among the eight diagnostic areas, heart rate is the most direct window into intensity.
Zone Distribution (Z1–Z5)
The chart shows what percentage of a session — or a selected period in total — was spent in each zone from Z1 through Z5. That alone tells you, at a glance, which intensity band you are actually training in.
- High Z1–Z2: Recovery and base aerobic swimming. Technical drill work and lighter volume sessions sit here.
- High Z3: Sustained swimming near the aerobic threshold. Comparable to marathon-effort intensity.
- High Z4–Z5: A large share of time above the lactate threshold. Interval sets, sprints, and race-pace work land here.
Solo swimmers often fall into a rhythm that "feels the same" lap after lap. Looking at the zone breakdown, it is not unusual to discover "I was stuck in Z3 the whole time" or "I intended Z2 recovery but the data says Z4."
Peak HR Trend
The trend of peak heart rate across weeks or months is trackable here. If your peak HR during the same interval set is gradually declining, cardiovascular adaptation is happening.
Recovery Heart Rate Trend — 1, 2, and 3 Minutes Post-Swim
Recovery HR measures how quickly your heart rate falls after the workout ends. The trend tracks your actual HR at the one-, two-, and three-minute marks across sessions.
As fitness improves, heart rate drops faster after sessions of the same intensity. When condition is poor or overtraining is creeping in, the recovery slows. When the AI coach mentions "heart rate recovery difference in the 1–3 minute window" in a weekly note, this is the specific metric it is referring to.
5. Try-This Drill Prescriptions — Distance, Sets, and Rest Included
Once the eight-area diagnosis is complete, the AI coach pairs a "focus on this area" recommendation with a concrete drill — the Try-This.
Why the Drills Are Specific
"Your pace needs work" and "8×100m, each set at threshold pace, 20 seconds rest between sets" are fundamentally different pieces of information. The first is a direction. The second is something you can walk into the pool and execute tomorrow.
FINNS Try-This drills are delivered with distance, set count, target intensity (for example: threshold pace or sustained Z4), and rest intervals. Some examples of the form they take:
- Threshold pace intervals: 8×100m — each 100m at threshold pace, 20 seconds rest between sets. Designed to lift the upper edge of your sustainable pace.
- Z2 base aerobic: 3×400m — maintain a comfortable Z2, 30 seconds rest between sets. Broadens aerobic base and supports faster recovery HR.
- SWOLF drill: 8×25m catch-up drill, consciously attending to distance per stroke (DPS). Focused on efficiency-area improvement.
- Breathing intervals: Alternate 3-stroke, 5-stroke, and 7-stroke breathing patterns across successive lengths. Targets the breathing-and-recovery area.
These prescriptions draw on swimming training methodology from domains like USA Swimming — the kind of coach-level session design that most amateur swimmers would not otherwise encounter. The key is that the suggestions are matched to your data context, not generic templates handed to everyone.
What Determines Which Drill You Receive
Which Try-This appears depends directly on the eight-area diagnosis results.
- Slow recovery HR combined with high Z4 proportion → breathing and recovery drills
- SWOLF trending upward → efficiency and stroke drills
- Weekly volume declining → frequency and volume recovery sessions
- Stroke composition heavily weighted toward freestyle → multi-stroke cross-training sets
Because the drill is tied to a diagnosed area, it is easier to understand why that particular drill was suggested — and to notice whether it is working.
6. Viewing the Longer Arc — Weekly, Monthly, Yearly, All-Time
Short-term data shapes what you do in the next session. But "how have I actually changed over the past three months" requires a wider window.
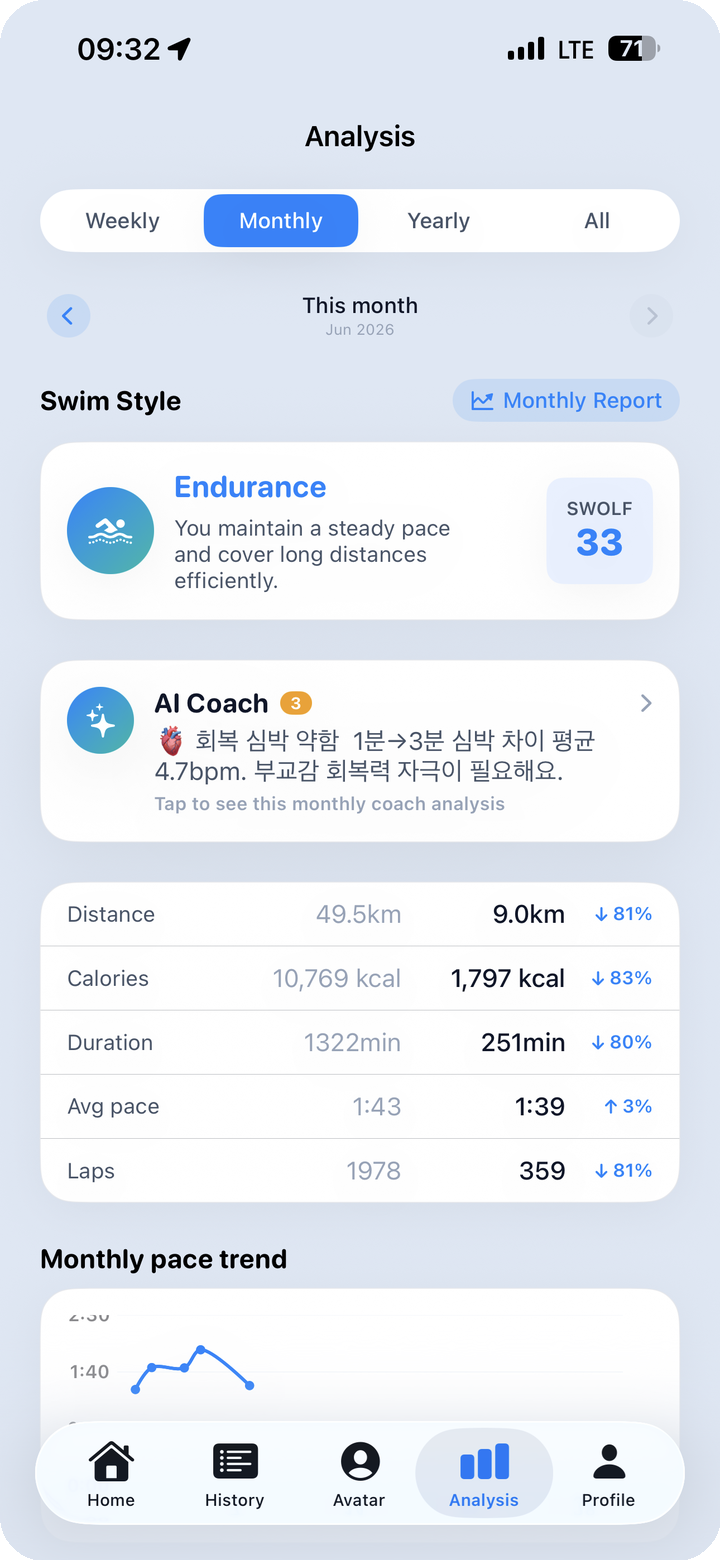
On the Analysis tab, switching the period to monthly or yearly redraws the same screen against that time span. The personality card (for example: Endurance Builder) and AI coach note regenerate from the data across that period, and the metrics and pace trend below update to match.
Things worth paying attention to in the long-term view:
- Pace trend: Covering the same distance at a progressively faster pace is a clear sign of developing fitness. Increasing volume while pace slows points toward a need to recalibrate intensity.
- Long-term SWOLF trend: At the monthly or yearly scale, a gradual efficiency curve that is invisible session to session sometimes becomes visible — a slow arc downward that means technique is consolidating.
- Stroke composition shifts: If the balance of strokes over the past six months looks different from the most recent three, training focus has shifted and the coaching notes will reflect that.
- Personality type changes: A shift from one personality type to another over a longer period — say, from Steady to Endurance Builder — reflects changes in both volume and intensity in the data.
For the full breakdown of how swim personality types are classified and what each type means in practice, see Post 05 — AI Coach and Swim Personality Types.
7. Closing — Closing the Loop Between Data and Action
Swim apps are generating more data than ever. What to actually do with it is a separate question.
The eight-area diagnosis and Try-This drills are the FINNS AI coach's attempt to close the loop between the number on the screen and the action in the water. A slow recovery HR diagnosis leads directly to what to swim next session. Rising SWOLF leads directly to which drill can address it.
For most of your solo swimming, there is no coach in the lane. Eight-area diagnosis and Try-This are an attempt to fill that gap with data context.